.png?width=250&height=54&name=ORIS%20logo%20Horizontal%20Colours%20(1).png)
Measuring carbon is only the starting point. The real value of ORIS is what comes next: understanding where the biggest impacts are, building credible alternatives, and quantifying the savings each option delivers. This article explains the full optimisation workflow in ORIS, from establishing a reference scenario to comparing design alternatives and material options side by side.
Step 1: Establish Your Reference Scenario
Step 2: Identify Carbon Hotspots Before Building Alternatives
Step 3: Create Alternative Scenarios
Step 4: Use the Comparison Dashboard to Evaluate the Options
Step 1: Establish Your Reference Scenario
Every optimisation exercise starts with a reference. In ORIS, this is your base Material Assessment: the current design, the conventional specification, or the most likely construction scenario. It does not need to be perfect, but it needs to be representative, because every alternative you create will be measured against it.
Set up the reference assessment with the same level of care you would apply to any deliverable: verify material quantities, check conversion factors, confirm transport assumptions, and review the results before using the assessment as a baseline for comparison.
Tip
Name your assessments clearly from the start
Once you start creating alternatives, your workspace will fill up quickly. Use descriptive names from the beginning: for example, 'Base Design', 'Low Carbon Alt 1 - RAP 40%', 'Low Carbon Alt 2 - GGBS Concrete'. This makes it much easier to manage and communicate your scenarios.
Step 2: Identify Carbon Hotspots Before Building Alternatives
Before creating any alternative scenarios, use the Results Dashboard to explore the results in a structured way, which reflects the same hierarchy defined in the Bill of Quantities and allows filtering and drilling down into materials and assemblies. This view helps you understand where the main carbon contributions sit in the design. From there, scenario work can focus on the areas that appear most relevant within the context of the project, rather than assuming a single dominant lever.
RESULTS DASHBOARD - BOQ BREAKDOWN
The Results Dashboard shows carbon and cost broken down by groups, subgroups, materials, transports, and construction operations. Scroll through the breakdown to identify which groups and materials account for the largest share of total carbon. In pavement projects, bituminous materials typically dominate. In structures, concrete and steel tend to drive results. In earthworks, transport distances are often the critical variable.
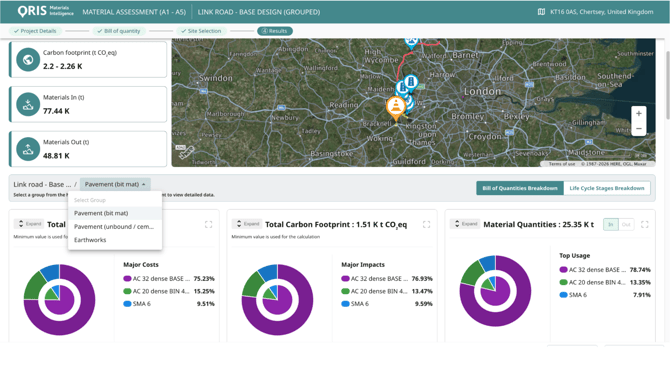
Results Dashboard of a Material Assessment, with a menu to select groups and subgroups for drill-down analysis.
OPEN BIM MODULE - CARBON HEATMAP
If you are working with a BIM model, use the carbon visualisation tool in the open BIM Module. It colour-codes every element in the model according to its A1-A3 carbon contribution, giving you an immediate spatial view of where the hotspots are. Elements shown in warmer colours are your priority targets for optimisation. This is especially useful on complex models where the BoQ breakdown alone does not make it obvious which physical elements are responsible for the highest impacts.
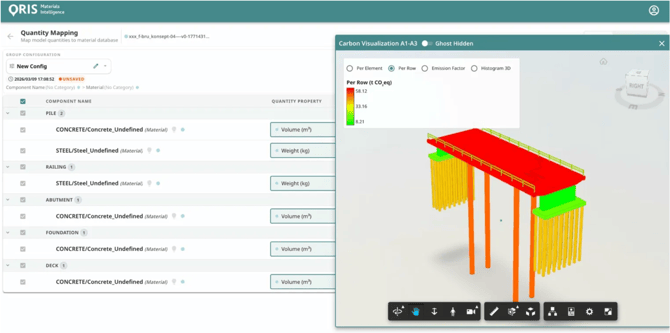
ORIS open BIM Module in the quantity mapping step, showing the integrated Carbon Visualisation tool after material mapping is completed.
Start with the highest-impact elements
A 10% carbon reduction on a material that accounts for 60% of total project carbon delivers six times more savings than a 10% reduction on a material that accounts for 10%. Always rank your hotspots before deciding where to focus your scenario analysis.
Step 3: Create Alternative Scenarios
Once you know where to focus, create alternative Material Assessments representing different design or procurement options. There are two main types of alternatives to consider.
ALTERNATIVE DESIGN OR GEOMETRY
Some carbon savings come from changes to the project scope or solution itself: a thinner pavement structure, a different structural form, or a revised alignment that reduces earthworks volumes. In these cases, the bill of quantities changes. Create a new Material Assessment (or duplicate the reference and modify it) with the updated quantities, and use the same material selection so the comparison isolates the design change.
ALTERNATIVE MATERIAL SELECTION
Other savings come from specifying a lower-carbon material within the same design: a higher RAP content in asphalt, a concrete mix with supplementary cementitious materials (e.g., GGBS or fly ash), recycled aggregate instead of virgin quarry material, or a warm-mix instead of hot-mix asphalt. In these cases, the quantities stay the same and only the material changes.
To model a material alternative:
• Open the reference assessment and click Duplicate. This copies the full assessment including all groups, materials, quantities, transport settings, and construction operations.
• Rename the duplicate clearly to reflect what has changed.
• Open the duplicated assessment and go to the Bill of Quantities.
• Find the material row you want to change, click to open it, and search for the alternative material in the database. Select it to replace the original.
• Verify the conversion factor, transport assumptions and construction operations still apply to the new material, and adjust if needed.
• Save and recalculate. The new results are immediately available in the Results Dashboard and ready for comparison.
Mixed scenarios: modelling partial substitution
If you want to evaluate a scenario where only part of a material is substituted (for example, 50% recycled aggregate and 50% virgin material), split the quantity across two separate material rows in the BoQ, one for each specification. ORIS will calculate the blended carbon result automatically.
Step 4: Use the Comparison Dashboard to Evaluate the Options
Once you have two or more assessments in the same workspace, the Comparison Dashboard brings them together for side-by-side analysis. You can then access the Comparison Dashboard from any of the Material Assessment by selecting Compare Results at the bottom right of the assessment dashboard, or by clicking the three vertical dots next to a material assessment in the assessment list and choosing Compare Results. The assessment you open it from becomes the reference: all other assessments are compared against it.
The dashboard provides three views:
• Overview. Total carbon and cost for each scenario, ranked against the reference. An immediate read on which option delivers the best outcome overall.
• Breakdown by material type, group or LCA Stage. Shows the carbon contribution of each material category, BoQ group or LCA stage across all scenarios. Use this to understand which specific elements are driving the difference between options.
• Differences. Highlights the carbon and cost delta between each scenario and the reference, broken down by material type, group or LCA Stage. This is the most useful view for reporting: it shows exactly where the savings come from and whether any group has increased in carbon as a result of the change.
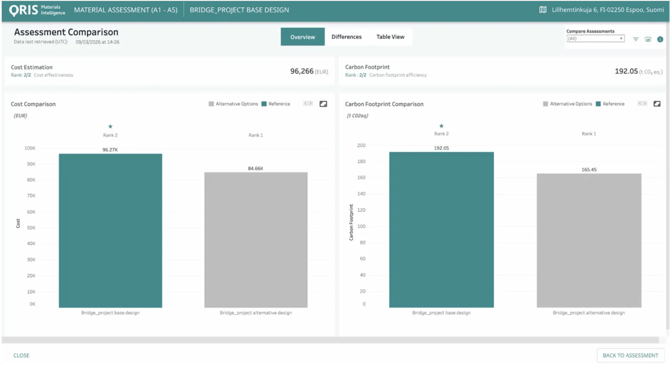
ORIS Comparison Dashboard, Overview page.
Always set the right reference before sharing results
The assessment you open the Comparison Dashboard from is automatically set as the reference. Make sure it is always your base scenario before exporting results or sharing screenshots, as all percentage savings are calculated relative to it.
All comparison results can be exported as CSV or captured as graphs for use in reports and presentations. The tabular view gives access to the full raw data behind the charts, which is useful when an appendix of detailed results is required.